5 min read
These are the 5 characteristics of a bad dashboard

A lot has been written about the characteristics of good dashboards, but how do you know if you are dealing with a bad one? Discover the 5 characteristics of a bad dashboard in this blog, and what you can do about them.
1 Doubts about data quality

One of the first characteristics of a bad dashboard is questionable data quality. When there are doubts about the data quality of a dashboard, you cannot be sure of the decisions you make based on that data. This is something you often see in organizations that work with Excel reports. Copies of original files are frequently used, leading to a proliferation of reports. The same problem arises when organizations start using multiple data visualization tools without a proper data warehouse or data management platform. Different departments may then use different definitions, creating multiple versions of the truth.
The solution:
A modern data warehouse or data management platform can ensure that all data comes together in one central place where definitions are created and stored. This makes it easy to give multiple tools, such as Qlik or Power BI, access to the same data while retaining your defined measures and dimensions. At E-mergo, we like to work with TimeXtender to build a solid data foundation. With this platform, you quickly unlock your data using CData connectors, with automated ETL scripts being written and your definitions captured in one central layer. From the Hub, you can easily and automatically push data to multiple analytics tools. Find more information about TimeXtender here.
2 No one steers by it
The second characteristic of a bad dashboard is when no one actually steers or adjusts course based on it. This problem can have many causes, such as the wrong KPIs or too many KPIs. KPIs can be ‘wrong’ when they are not SMART (Specific, Measurable, Actionable, Relevant, Timely) or when they are not properly aligned with the goals you want to achieve.
However, showing lots of SMART KPIs in a dashboard does not make it a good dashboard either. If there is too much to look at, it becomes hard for users to know what to focus on. A good dashboard should tell a clear story based on the data. By putting the right information in the right place, it should help users realize the KPIs they need to achieve their goals.
The solution:
In the blog Do your KPIs measure what you really want to know? we discuss how important it is to take a good look at your KPIs. In it, we discuss, for example, the KPI tree technique, which lets you easily cascade your KPIs so you can see which factors affect each other. That way, you know exactly which KPIs to steer on to achieve an overarching goal.
3 Context is missing

The third characteristic of a bad dashboard is a lack of context. Data without context does not say very much. If you only look at revenue without a target or a comparison with a previous period, you still do not know where you stand. Without this kind of context, you do not know the whole story, or the data may even be misinterpreted. This makes it difficult to make well-founded decisions about the course you are going to take.
The solution:
Useful context such as targets, legends, alternate states and Natural Language Processing (NLP) technologies such as the Insight Bot or Narrative Science give you a more complete picture of the data, so you can make better decisions.
4 The wrong data visualizations
The fourth characteristic of a bad dashboard is the use of the wrong data visualizations. This may sound obvious, but in practice we still see it happen far too often. Using the wrong visualization in your dashboard can undermine the interpretation of the data. The design of your dashboard, and with it the choice of data visualizations, must above all be functional.
The solution:
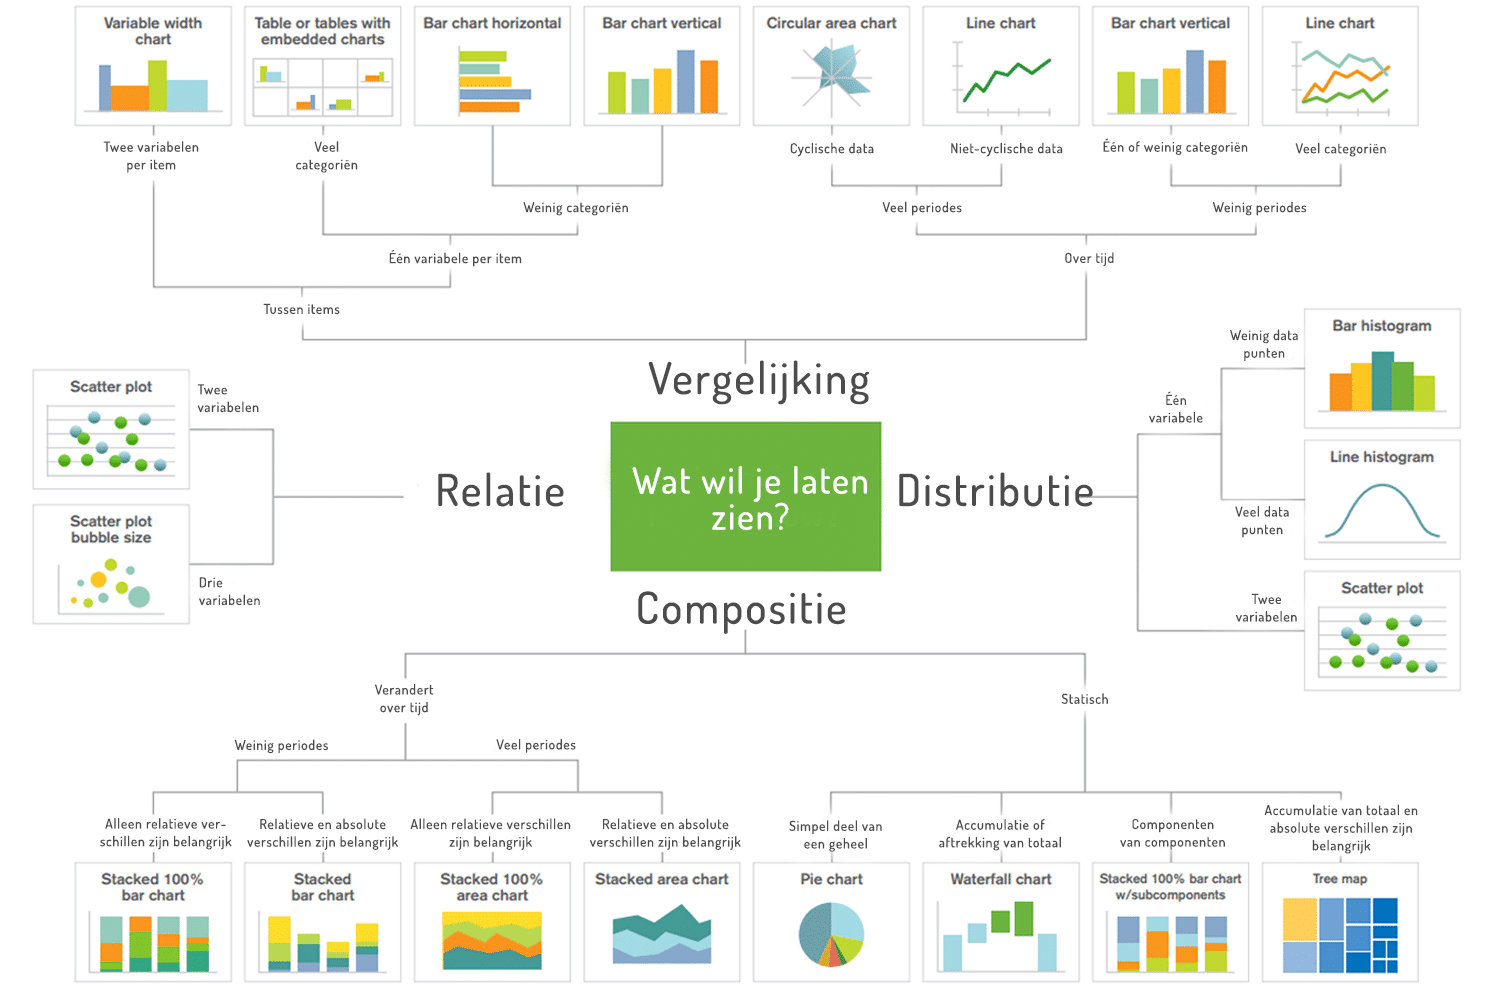
In this decision chart from Qlik, you can easily find which data visualization best suits your data. Choosing the right visualization avoids confusion and ensures the data is interpreted correctly. Besides choosing the right visualization, it is also important not to use too many, so the overview stays clear. Read the blog ‘10 pitfalls of dashboard design’ for more important points to keep in mind when designing your dashboard.
5 Poor use of color
The fifth and final characteristic of a bad dashboard is incorrect or excessive use of color. In data visualizations, color can be used to show differences, emphasize certain information or show the relationship between pieces of information. Used incorrectly, it can cause confusion. Think, for example, of a dashboard in which colors indicate different categories. If one of those category colors is also used in another visualization to indicate something else, users may think it refers to that category and draw the wrong conclusions.
The solution:
The use of color can have a big impact on a dashboard. Colors should therefore be used carefully and, above all, consistently. Furthermore, they should only be used when they carry meaning and therefore add something to the dashboard. Finally, it is also important to take color blindness into account; around 10% of men and 1% of women are affected by it.
Getting started with a good dashboard
Take a look at the tips and reference material below for more information about good dashboards, or get in touch with us to see what we can do for you.
Tips & reference material
- [training] Dashboard Design
- [blog] The KPI tree
- [blog] This is why your KPIs fail
- [blog] 10 pitfalls of dashboard design
- [blog] Qlik Sense tip: Alternate States
- [ebook] 7 data visualization tips
- [book] Information Dashboard Design – Stephen Few
- [book] Show Me the Numbers – Stephen Few
- [book] Now You See It – Stephen Few
- [book] Envisioning Information – Edward Tufte
- [book] Data Visualisation: A Handbook for Data Driven Design – Andy Kirk